
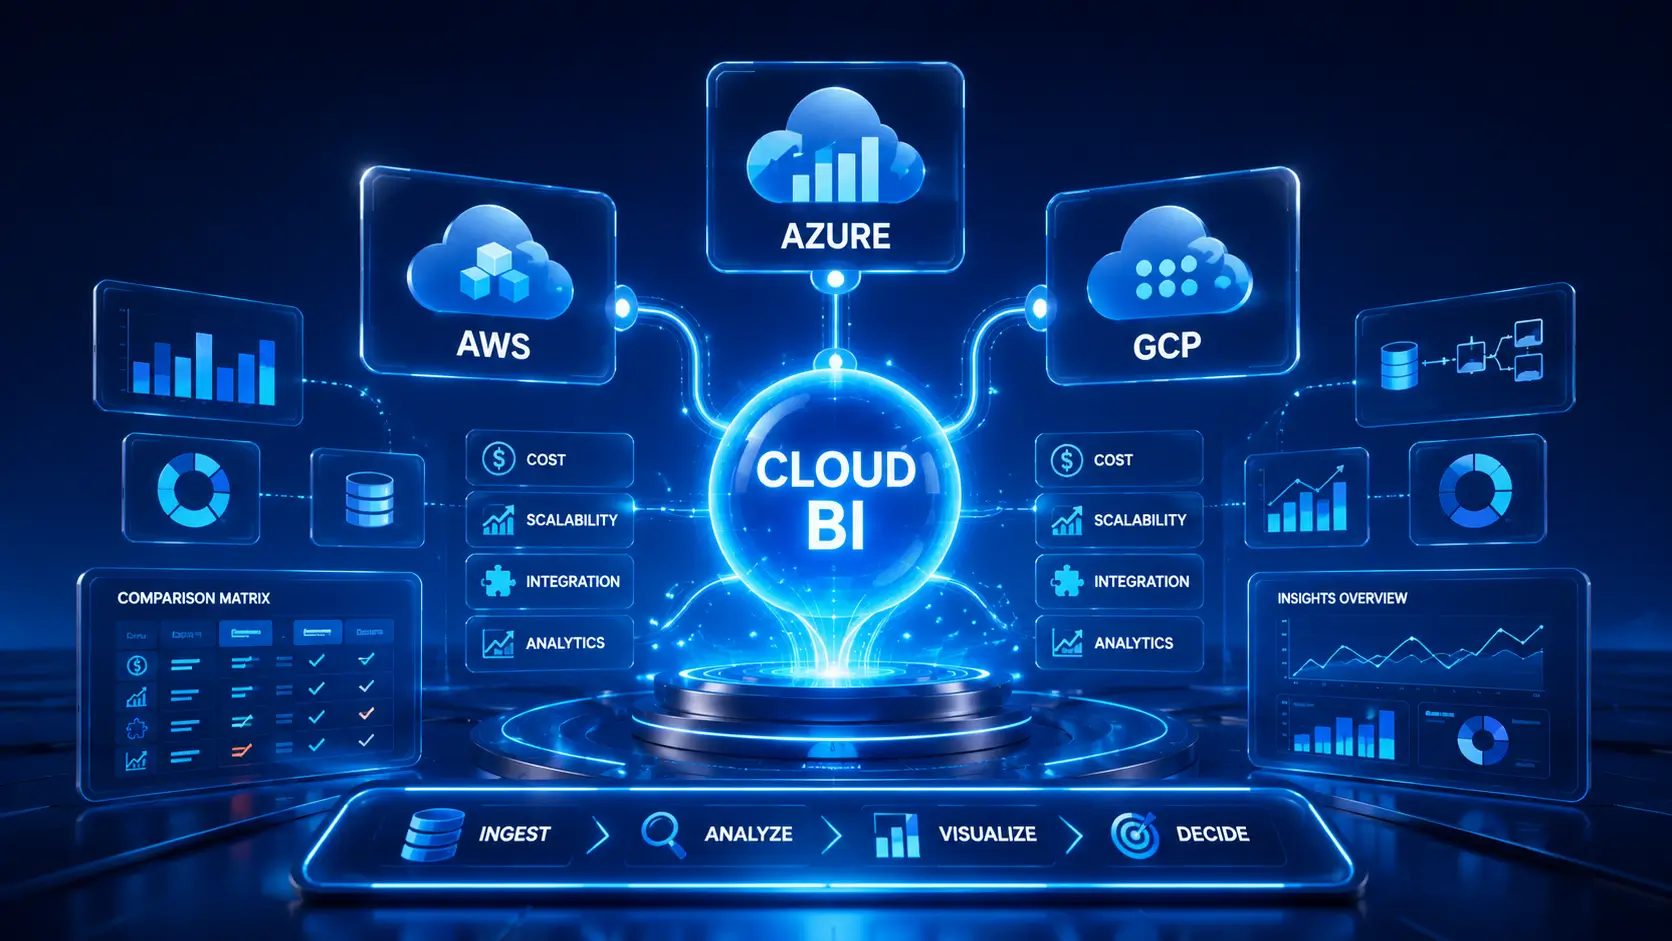
Business intelligence in the cloud: AWS vs Azure vs GCP
Choosing the right cloud platform for Business Intelligence is one of the most important architecture decisions a CTO can make. AWS, Azure and GCP all offer mature Cloud BI stacks, but they differ in pricing, AI capabilities, governance, data warehouse architecture and ecosystem fit. This guide compares the three platforms and gives a practical decision framework for choosing the right one.
What is Cloud Business Intelligence?
Cloud Business Intelligence combines managed data warehouses, self-service analytics tools, dashboards, data governance and AI-driven insights on public cloud infrastructure.
Traditional on-premise BI often requires infrastructure management, manual scaling, long upgrade cycles and high upfront cost. Cloud BI changes the model. Instead of maintaining servers and reporting infrastructure, companies can use managed services such as Amazon Redshift, Azure Synapse Analytics, Google BigQuery, Power BI, QuickSight or Looker.
The main benefits are:
- faster implementation
- lower infrastructure maintenance
- elastic scaling
- easier integration with cloud applications
- stronger support for real-time analytics
- access to AI and machine learning services
- better fit for modern data lakehouse architecture
Cloud BI is not only a dashboarding decision. It is part of a broader cloud strategy. The platform you choose affects data pipelines, governance, security, cost control, AI roadmap and how easily business users can access trusted data.
If your organization is already planning a cloud migration or cloud modernization project, Webellian’s Cloud and security services can support the infrastructure, security and architecture layer behind a modern BI environment.
AWS BI stack: QuickSight, Redshift and the Amazon analytics ecosystem
AWS is a strong Cloud BI choice for companies already running applications, data pipelines or infrastructure on Amazon Web Services. Its BI stack is built around Amazon QuickSight for dashboards, Amazon Redshift for data warehousing and services such as AWS Glue, Athena, Lake Formation, S3, SageMaker and Amazon Bedrock.
QuickSight is AWS’s native BI and visualization tool. It supports dashboards, embedded analytics, natural language questions, ML-powered insights and SPICE, an in-memory engine designed to speed up dashboard performance. It is usually a good fit for AWS-native companies that want to keep analytics close to their existing data environment.
Redshift is the core data warehouse option in the AWS BI ecosystem. It works well for structured analytics workloads, especially when companies already use S3, Glue, Athena or other AWS services. Redshift Serverless also helps teams avoid some cluster management work, although cost governance still requires attention.
AWS is strongest when:
- your data already lives in AWS
- your team has AWS skills
- you need strong integration with S3, Glue, Athena or SageMaker
- you want embedded BI inside AWS-based applications
- you prefer a broad cloud ecosystem over a single BI-first platform
The main limitation is self-service depth. QuickSight is improving, especially with Amazon Q and generative BI capabilities, but business users familiar with Excel or Power BI may still find Microsoft’s BI experience more natural.
For companies building analytics into custom platforms, Webellian’s Digital Factory can help connect BI outputs with web, mobile or API-based product experiences.
Azure BI stack: Power BI, Synapse Analytics and Microsoft Fabric
Azure is usually the default Cloud BI choice for Microsoft-centric organizations. If your company already uses Microsoft 365, Teams, Excel, Dynamics, Azure Active Directory or Azure cloud infrastructure, Power BI and the broader Microsoft data ecosystem can reduce adoption friction.
Power BI is the strongest self-service BI tool among the three native cloud options. Business users know the Microsoft interface, analysts often understand Excel logic, and IT teams can manage access through familiar Microsoft identity and governance controls.
The Azure BI stack includes:
- Power BI for reports and dashboards
- Azure Synapse Analytics for data warehousing and lakehouse workloads
- Microsoft Fabric as a unified data and analytics platform
- Azure Data Factory for data integration
- Microsoft Purview for governance and data catalog
- Azure OpenAI and Copilot for AI-augmented analytics
Power BI is especially strong for dashboard adoption across business teams. It supports self-service analytics, embedded BI, row-level security, semantic models and strong integration with Microsoft 365.
Azure is strongest when:
- your company is already a Microsoft shop
- business users depend heavily on Excel and Teams
- you need wide BI adoption across departments
- governance and identity should stay inside Microsoft tools
- Copilot and Azure OpenAI are part of the roadmap
The main challenge is licensing and platform complexity. Power BI, Fabric, Synapse and Azure services can overlap, and cost can grow if capacity, refresh frequency, data movement and workspace governance are not planned upfront.
If your BI roadmap involves team extension or additional Microsoft data specialists, Webellian’s IT Resource Center can help build the right temporary or long-term team around implementation.
GCP BI stack: Looker, BigQuery and Google Data Cloud
GCP is the strongest option when Cloud BI is built around large-scale analytics, serverless data warehousing, machine learning and governed semantic modeling.
The core GCP BI stack includes:
- BigQuery as a serverless data warehouse
- Looker for enterprise BI and semantic modeling
- Looker Studio for lighter self-service reporting
- Vertex AI and Gemini for AI-assisted data workflows
- Dataflow, Pub/Sub and Dataplex for data engineering and governance
BigQuery is the main reason many data-first companies choose GCP. It is serverless, scales well for large analytical workloads and supports both on-demand query pricing and capacity-based pricing. This makes it attractive for companies that want to avoid cluster management and focus on query design, data modeling and cost control.
Looker is different from traditional dashboard-first BI tools. Its main strength is the semantic layer. With LookML, data teams can define business logic, metrics and relationships centrally, so business users explore governed data instead of building conflicting versions of the same KPI.
GCP is strongest when:
- your company is data-first or ML-heavy
- BigQuery is already part of your architecture
- you need a strong semantic layer
- you want serverless analytics
- you plan to use Vertex AI or Gemini in data workflows
- analytics is part of the product experience
The main limitation is entry cost and adoption. Looker is typically more enterprise-oriented and quote-based, while Looker Studio is easier to start with but less powerful for governed enterprise BI. For smaller teams, GCP can be excellent technically, but the operating model must be designed carefully.
For organizations moving toward ML-powered analytics, Webellian’s Data Science and AI services can support model development, experimentation and deployment.
AWS vs Azure vs GCP BI feature comparison
No Cloud BI platform wins in every category. Azure usually leads in business-user adoption, AWS in ecosystem breadth, and GCP in serverless analytics and semantic modeling.
| Dimension | AWS | Azure | GCP |
| Native BI tool | QuickSight | Power BI | Looker / Looker Studio |
| Data warehouse | Redshift | Synapse / Fabric | BigQuery |
| Best fit | AWS-native companies | Microsoft-centric enterprises | Data-first and ML-heavy teams |
| Self-service BI | Medium | High | Medium to high |
| Semantic layer | Limited | Strong semantic models | Strong LookML layer |
| AI integration | Amazon Q, Bedrock, SageMaker | Copilot, Azure OpenAI | Gemini, Vertex AI |
| Embedded BI | Strong | Strong | Strong |
| Real-time analytics | Strong with Kinesis and related services | Strong with Fabric and Azure stack | Strong with Pub/Sub, Dataflow and BigQuery |
| Cost model | Per-user, SPICE, warehouse and service usage | Per-user, capacity, Fabric and Azure usage | Query, slots, platform and user pricing |
| Governance | Lake Formation, Glue Data Catalog | Purview, Microsoft identity | Dataplex, LookML, IAM |
| Lock-in risk | Medium to high | Medium to high | Medium to high |
A simple way to think about the choice:
- Choose AWS if your workloads, data lake and engineering team are already AWS-native.
- Choose Azure if your business users live in Microsoft 365, Excel and Teams.
- Choose GCP if BigQuery, ML, serverless analytics or semantic modeling are central to your data strategy.
For regulated or complex organizations, the best answer may also include hybrid architecture. For example, Power BI can connect to AWS or GCP data sources, and a company can use Snowflake, dbt or open data formats to reduce vendor lock-in.
Security, compliance and data governance in Cloud BI
Security is one of the main reasons Cloud BI should be treated as an architecture decision, not a reporting tool decision.
All three platforms offer enterprise-grade security capabilities, but they differ in how governance is implemented. The right choice depends on identity management, data residency, compliance requirements, audit needs and the maturity of your data governance process.
Key areas to evaluate:
- row-level security
- role-based access control
- encryption
- audit logs
- data lineage
- data catalog
- data residency
- DPA and GDPR requirements
- integration with existing identity providers
- separation of development and production workspaces
AWS often fits companies already using IAM, Lake Formation and Glue Data Catalog. Azure is strong for companies using Microsoft Entra ID, Purview and Microsoft compliance tooling. GCP works well for organizations that want BigQuery IAM, Dataplex and Looker’s governed semantic layer.
The most important rule: do not let dashboard access become the governance model. Permissions should be designed at the data, semantic and reporting layers. Otherwise, companies quickly create dashboards that expose too much data to too many users.
For Cloud BI projects where infrastructure security, CI/CD, compliance and access control matter, Webellian’s Cloud and security services can support the technical foundation.
Migrating from on-premise BI to the cloud
Migrating from on-premise BI to Cloud BI is not just moving dashboards. It usually requires redesigning data pipelines, cleaning source data, rewriting ETL logic, validating metrics and training users.
A practical migration path has five steps:
- Assess current reports, data sources, owners and pain points.
- Design the target architecture, including warehouse, semantic layer and governance.
- Migrate data pipelines and priority dashboards.
- Validate KPIs, permissions and performance.
- Optimize cost, adoption and operating model.
A useful effort estimate:
| Complexity | Data volume | Typical timeline | Effort |
| Low | Under 100 GB | 1-3 months | 2-4 person-months |
| Medium | 100 GB-1 TB | 3-6 months | 6-12 person-months |
| High | Over 1 TB plus complex logic | 6-12 months | 12-24+ person-months |
The biggest migration risks are usually not technical dashboards. They are:
- unclear KPI ownership
- poor data quality
- undocumented ETL logic
- duplicated reports
- hidden spreadsheet dependencies
- user resistance
- vendor lock-in
- underestimated testing effort
A good migration should start with a focused assessment sprint. Instead of rebuilding every report, identify which dashboards are actually used, which KPIs matter and which data flows should be modernized first.
For more context on BI architecture in a regulated environment, see Webellian’s article on Business Intelligence in the financial sector.
How to choose the right Cloud BI platform
The right Cloud BI platform is not the one with the longest feature list. It is the one that matches your cloud footprint, team skills, data volume, governance requirements and 3-year roadmap.
Use this scoring framework before committing to AWS, Azure or GCP:
| Criterion | Weight | AWS wins when | Azure wins when | GCP wins when |
| Existing cloud vendor | 25% | You are already AWS-native | You are a Microsoft shop | You already use GCP or BigQuery |
| Team skills | 20% | Team has AWS and data engineering skills | Users know Power BI, Excel, Teams | Team has SQL, Python and BigQuery skills |
| Data workload | 20% | Mixed app and analytics workloads | Structured enterprise reporting | Large-scale analytics and ML |
| Governance | 15% | AWS controls are already mature | Microsoft identity and Purview are standard | Semantic layer and BigQuery governance matter |
| TCO | 15% | Small to mid-sized AWS-native deployment | Broad enterprise dashboard adoption | High-query-volume analytics |
| AI roadmap | 5% | SageMaker, Bedrock, Amazon Q | Copilot, Azure OpenAI | Vertex AI, Gemini, BQML |
A simple decision tree:
- If your company is already on AWS and needs BI inside an AWS ecosystem, choose QuickSight + Redshift.
- If your company uses Microsoft 365, Excel, Teams and Azure, choose Power BI + Fabric or Synapse.
- If your company is data-first, ML-heavy or already using BigQuery, choose BigQuery + Looker.
- If you want to reduce vendor lock-in, consider an architecture with open formats, dbt, Snowflake or a vendor-neutral semantic layer.
Do not choose the platform only because of the license price. Choose the platform that your team can govern, scale and actually use.
Webellian helps companies design and implement BI environments through Business Intelligence and Data Analytics solutions. The team supports data warehouse setup, KPI definition, dashboards, reporting processes and data-driven decision systems. If you are comparing AWS, Azure and GCP for Cloud BI, Webellian can help you assess the architecture, estimate TCO and choose a platform that fits your business roadmap.
FAQ: Cloud BI, AWS, Azure and GCP
What is the best cloud platform for Business Intelligence?
There is no single best Cloud BI platform for every company. AWS is strong for AWS-native teams, Azure is best for Microsoft-centric enterprises, and GCP is a strong fit for BigQuery, ML-heavy and data-first organizations.
How does AWS QuickSight compare to Power BI?
QuickSight is strong for AWS-native dashboards, embedded analytics and integration with AWS services. Power BI is usually stronger for business-user adoption, self-service analytics and Microsoft 365 integration.
Is Looker better than Power BI?
Looker is better when a governed semantic layer and LookML-based metric definitions are critical. Power BI is better when broad self-service adoption, Excel familiarity and Microsoft ecosystem integration matter more.
What is the difference between Synapse Analytics and Power BI?
Azure Synapse Analytics is used for data warehousing, processing and analytics architecture. Power BI is the visualization and self-service reporting layer that sits on top of governed data.
How much does Cloud BI cost?
Cloud BI cost depends on licenses, compute, storage, data movement, implementation and support. Entry-level costs can start with low per-user pricing, but enterprise TCO depends heavily on usage, capacity and governance.
Can I use Power BI with AWS or GCP?
Yes. Power BI can connect to AWS and GCP data sources, including databases and cloud warehouses. This can be useful when business users prefer Power BI but the data platform runs outside Azure.
What is the best cloud data warehouse for BI?
Redshift fits AWS-native workloads, Synapse fits Microsoft-centric enterprise reporting, and BigQuery is strong for serverless, large-scale and ML-heavy analytics.
How do I avoid vendor lock-in in Cloud BI?
Use open formats, documented data models, portable ETL logic, dbt or a governed semantic layer. Keep business definitions outside individual dashboards and make sure the company owns the data model.
How long does Cloud BI implementation take?
A small Cloud BI implementation may take 1-3 months. Medium and enterprise migrations often take 3-12 months depending on data volume, ETL complexity, governance and user adoption needs.
What is the difference between Looker and Looker Studio?
Looker is an enterprise BI platform with semantic modeling, governance and embedded analytics capabilities. Looker Studio is better for lighter, self-service reporting and simpler dashboard needs.