
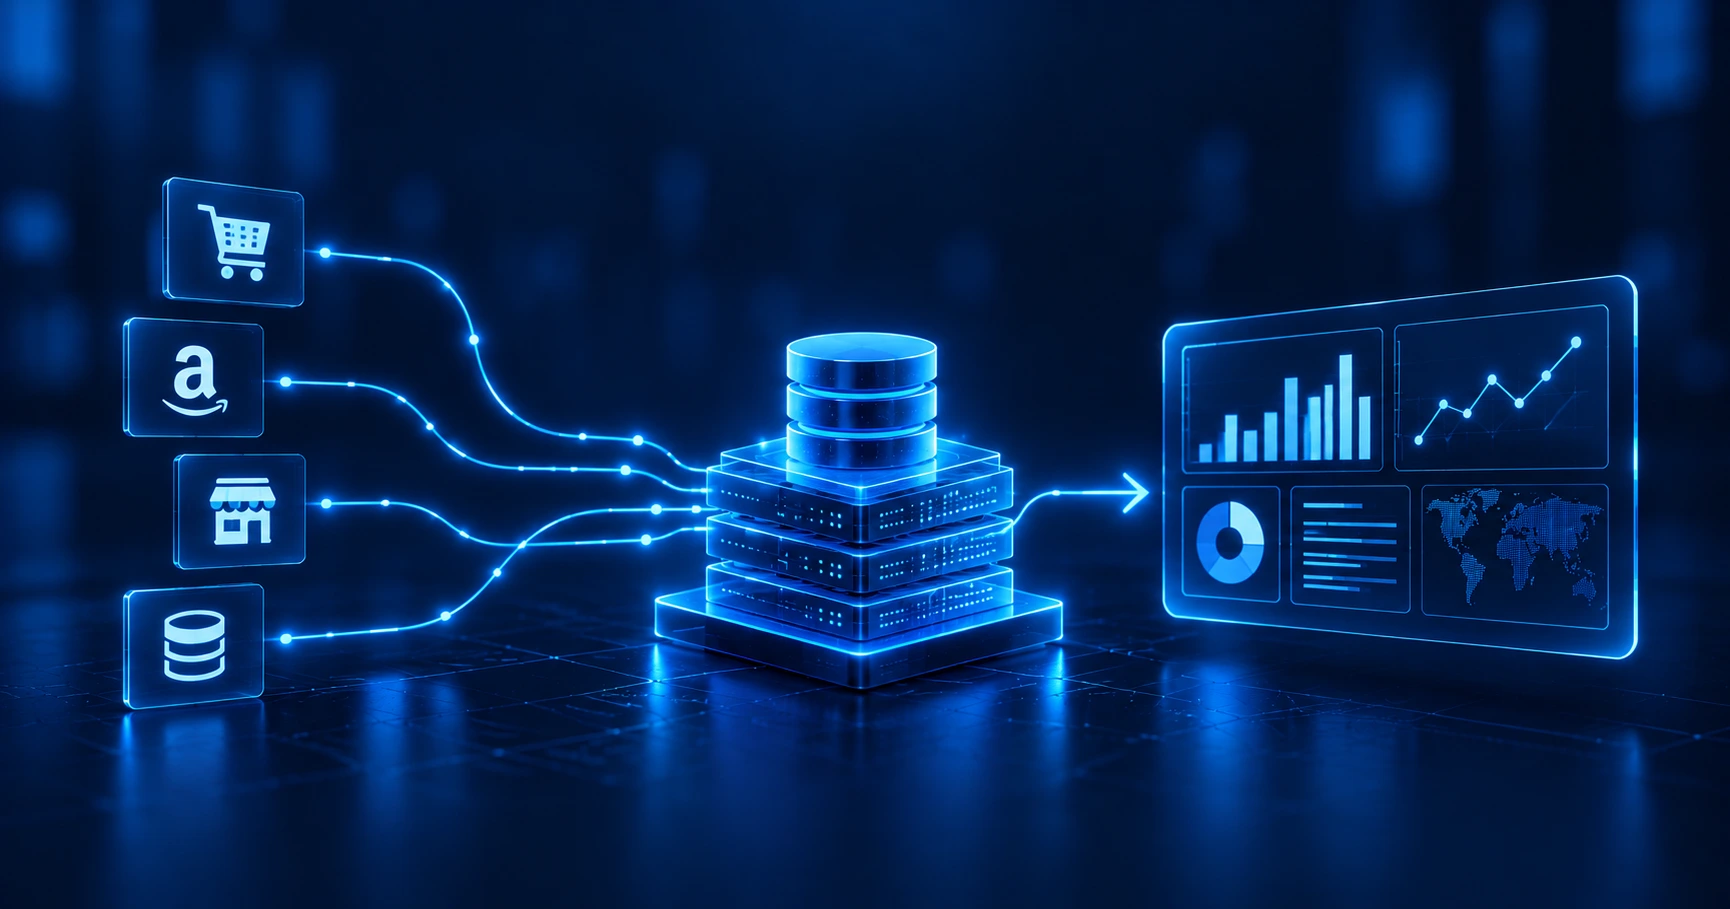
E-commerce BI architecture: turning fragmented commerce data into a decision layer
E-commerce business intelligence is not another dashboard layer. It should be used to connect order, product, customer, marketing, inventory, and behavioral data into a governed decision system. For enterprise commerce teams, the real challenge is integrating that intelligence with the cloud, warehouse, and applications they already operate.
What business intelligence for e-commerce actually means
We define e-commerce business intelligence as the process of turning transactional, behavioral, and operational commerce data into governed metrics and decisions across the business.
A dashboard is only the visible end of that architecture.
The data underneath may come from an order management system, product information platform, CRM, warehouse management system, storefront, advertising platform, payment provider, customer service application, and several regional or marketplace channels.
Each system knows one part of the customer or commercial process. None necessarily has the complete picture.
That is why enterprise e-commerce BI is different from simply enabling the reporting module inside a commerce platform.
The objective is to create a common decision layer where teams can answer questions such as:
- Which acquisition channels produce customers with the highest lifetime value?
- Which products are likely to stock out after a campaign launches?
- Is conversion falling because of traffic quality, inventory availability, price, or checkout performance?
- Which customer segments are becoming less active?
- What is the real return on marketing spend after cancellations, refunds, and contribution margin?
The answers require data from several systems to use the same definitions.
That is also the distinction we make between reporting and a broader analytical platform in our business intelligence vs data analytics guide. BI becomes strategically useful when it is connected to the wider data architecture rather than treated as a collection of isolated reports.
Where e-commerce data actually lives
E-commerce BI starts with mapping the systems that create business facts before deciding how dashboards, AI, or forecasting should consume them.
A typical enterprise commerce environment may look like this:
| System | Typical data | Why BI needs it |
| OMS | Orders, returns, cancellations, fulfillment state | Revenue, order lifecycle, returns analysis |
| PIM | Product attributes, categories, variants | Merchandising and product performance |
| CRM / CDP | Customer profiles, segments, interactions | Customer 360, retention, CLV |
| WMS | Inventory, warehouse movements, availability | Stock analysis and fulfillment |
| Storefront | Sessions, carts, checkout, purchases | Funnel and conversion analysis |
| Marketing platforms | Spend, clicks, campaigns, audiences | Attribution and ROAS |
| Customer service | Cases, complaints, reasons for contact | Retention and service analytics |
| Payment systems | Payment state, refunds, transaction metadata | Financial reconciliation and payment performance |
Google Analytics illustrates why even one source can contain more detail than a standard dashboard exposes. GA4 can export raw event data into BigQuery, where it can be combined with external datasets. Google supports both daily and continuous intraday exports, and the export schema contains e-commerce events and purchase-revenue fields.
But behavioral event data alone still does not tell us whether an order was later cancelled, whether the customer returned the product, what the contribution margin was, or whether fulfillment was delayed.
Those facts live elsewhere.
Omnichannel and multi-location data
The integration problem becomes harder when an organization operates several storefronts, countries, currencies, warehouses, or marketplaces.
A single business concept such as net revenue may depend on local taxes, currencies, refunds, shipping rules, and regional order systems. Inventory may have to be analyzed at SKU, warehouse, store, market, or available-to-promise level.
We therefore prefer to normalize these concepts in the data platform rather than rebuild them separately in every dashboard.
The same principle applies to customer identity. Email, CRM ID, loyalty ID, device ID, account ID, and marketplace identifiers may all refer to the same person or organization, but the architecture should not assume they can always be merged automatically.
Customer 360 starts with identity rules, not a visualization.
Architecting the data layer: warehouse, ELT, and semantic metrics
A production e-commerce BI platform usually needs a governed analytical foundation, typically a cloud warehouse or lakehouse, reliable ingestion and transformation, and a semantic layer that defines business metrics consistently.
We normally separate the architecture into four parts.
The first is ingestion. Data arrives from commerce APIs, databases, web and app events, SaaS applications, files, streams, or CDC pipelines.
The second is storage and transformation. Platforms such as Snowflake, BigQuery, Databricks, or Microsoft Fabric can centralize analytical data while ELT pipelines standardize entities such as orders, customers, products, campaigns, and inventory.
The third is the semantic or metrics layer. This is where definitions such as net sales, active customer, return rate, contribution margin, repeat-purchase rate, or ROAS should become explicit and reusable.
The fourth is the consumption layer, including BI, notebooks, data applications, APIs, machine learning models, and increasingly AI agents.
This separation prevents one of the most common BI problems: moving inconsistent business logic from source systems into inconsistent dashboard logic.
If one report defines revenue before refunds and another after refunds, the organization has a metric-governance problem, not a visualization problem.
Our cloud data mart guide goes deeper into how curated analytical layers can sit between enterprise data platforms and BI consumption.
Reverse ETL: moving decisions back into operational systems
A mature BI architecture should not only move operational data into the warehouse.
Some insights need to move back out.
A retention model may calculate a churn-risk segment in the warehouse, but the value appears only when that segment reaches the CRM or marketing platform. A merchandising model may identify products that need promotion, but the decision may need to reach a campaign or storefront workflow.
This pattern is often described as reverse ETL or data activation.
We treat it as part of the architecture rather than a separate marketing function. The warehouse can become a governed source of derived customer, product, and operational data, while controlled downstream integrations distribute those results to the systems that act on them.
The important word is controlled. Activating a metric back into Salesforce, Braze, an advertising audience, or a commerce platform should preserve permissions, lineage, refresh logic, and ownership.
Real-time vs batch analytics
Not every e-commerce metric needs real-time processing. We match data freshness to the speed at which the business can act on the result.
Some questions work perfectly well with daily or hourly processing.
Finance reporting, long-term CLV trends, cohort retention, historical campaign analysis, and many executive metrics do not become more valuable simply because they refresh every second.
Other use cases have a much shorter decision window.
Inventory availability during a promotion, operational incidents, live campaign pacing, fulfillment exceptions, and selected risk-monitoring use cases may justify near-real-time or streaming architecture. Fraud analytics can use streaming data to identify suspicious patterns, but real-time authorization and intervention decisions typically belong to dedicated fraud prevention or risk systems.
BigQuery, for example, supports streaming ingestion through its Storage Write API, including data that can become queryable once acknowledged by the service. It also supports change-data-capture patterns for applying streamed updates to tables.
The technical capability does not mean everything should use it.
Streaming increases architectural complexity: event ordering, duplication, late data, reconciliation, observability, and cost all become more important.
A useful design question is therefore:
How late can this information arrive before the business decision loses value?
That is a better starting point than “Can we make the dashboard real time?”
Customer 360 and Customer Lifetime Value
A customer 360 model is useful only when identity, transactions, behavior, and service history can be connected under governed rules rather than merely displayed on the same screen.
For an enterprise e-commerce organization, a useful customer model may combine:
- orders and returns;
- product interactions;
- marketing acquisition data;
- loyalty activity;
- customer service history;
- account or subscription information;
- consent and channel preferences.
The difficult part is identity resolution and data semantics.
Privacy, consent, and payment-data boundaries are equally important when building a Customer 360 model. Customer identifiers should only be joined when there is an appropriate legal basis and a clear business purpose for doing so. For European organizations, this means considering GDPR principles such as purpose limitation, data minimisation, consent or another applicable legal basis, and appropriate access controls.
A BI platform should also avoid unnecessarily expanding the PCI DSS cardholder data environment. In many cases, analytical use cases require payment status, transaction outcomes, or payment-method information rather than sensitive payment-account data. Tokenized or less sensitive representations can often support reporting and analytics without bringing additional cardholder-data exposure into the analytical environment.
A browser event, CRM record, transaction, and service ticket may not initially share the same identifier. The architecture needs rules for when records can be joined, when they should remain separate, and what confidence is required.
That matters for privacy as much as analytics.
Once the identity layer is reliable, the organization can calculate Customer Lifetime Value, repeat-purchase behavior, churn risk, cohort performance, and segment profitability using a consistent history.
CLV should also be connected to acquisition economics.
A campaign with a low customer acquisition cost can still be unattractive if those customers purchase once, return heavily, or require unusually expensive service. A higher-cost channel may be more valuable when it attracts repeat customers with stronger margins.
Customer intelligence therefore becomes more useful when marketing, transaction, returns, and service data meet in the same analytical foundation.
Marketing attribution and demand forecasting
The strongest commerce intelligence connects customer acquisition with product and inventory decisions rather than optimizing marketing and supply independently.
Marketing attribution and ROAS
Marketing platforms are excellent at reporting the interactions they can see.
Enterprise BI needs to reconcile those views with actual commercial outcomes.
A campaign may generate high attributed revenue but also attract heavily discounted orders or high return rates. Another may acquire customers who produce less immediate revenue but substantially better repeat purchases.
For that reason, we prefer to calculate business-level marketing metrics using governed order and customer data alongside platform attribution.
That does not mean replacing every platform’s attribution model. It means understanding what each metric actually measures.
ROAS can remain useful for campaign optimization, while contribution margin, CAC payback, repeat purchase, and CLV answer different questions.
Demand forecasting and inventory analytics
The same data platform can connect marketing signals to supply.
Historical sales, promotions, seasonality, price changes, product attributes, inventory, lead times, and campaign plans can support demand forecasts at category or SKU level.
The goal is not a single perfect forecast.
It is a decision process that can compare expected demand with available stock, inbound inventory, warehouse capacity, and marketing activity.
This helps prevent a familiar e-commerce failure: increasing paid demand for an item that is already moving toward a stockout, while excess inventory sits elsewhere in the catalog.
Predictive and agentic AI in e-commerce BI
Predictive analytics estimates what may happen next, while agentic systems can use those predictions and other enterprise context to recommend or execute the next permitted action.
The difference matters architecturally.
A demand model may forecast that a SKU is likely to stock out.
A generative AI interface might explain the forecast to a merchandiser.
An AI agent could go further: retrieve upcoming campaigns, check inbound inventory, evaluate a predefined policy, recommend a campaign adjustment, and prepare the change for approval.
The useful part is not the agent label. It is the connection to governed enterprise context and controlled tools.
We would therefore avoid building an autonomous commerce agent directly against raw operational systems. It should use curated data, explicit permissions, controlled APIs, observability, and human approval where the action has material commercial impact.
The same foundation described throughout this article becomes the prerequisite for reliable AI: consistent metrics, customer and product identities, data lineage, quality controls, and governed access.
Our guide to how AI is transforming business intelligence explores the shift from passive dashboards toward AI-assisted decision systems in more detail.
A practical implementation roadmap
We would sequence an enterprise e-commerce BI program from business decisions and source data to governance and metrics, then add real-time processing and AI where they create measurable value.
Phase 1: map decisions and data
Start with decisions, not dashboards.
Identify a small number of business questions such as customer profitability, inventory availability, marketing efficiency, retention, or order performance.
Map which source systems contain the required facts, who owns them, how frequently they change, and which identifiers connect them.
Phase 2: build the analytical foundation
Establish ingestion, warehouse or lakehouse models, data quality checks, and core entities such as customer, product, order, inventory, and campaign.
Do not attempt to migrate every historical dashboard at this point.
Define the small set of metrics that need enterprise-wide consistency first.
Phase 3: establish semantic governance
Document metric definitions, owners, refresh expectations, access controls, and lineage.
This is where definitions such as net revenue, active customer, conversion rate, return rate, inventory availability, and CLV should stop being local spreadsheet formulas.
Phase 4: deliver priority use cases
Build dashboards and analytical products around the decisions identified at the start.
Measure whether teams actually use them to change pricing, merchandising, marketing, inventory, or customer strategy.
Phase 5: add activation and AI
Once the data is trusted, move selected segments, scores, and decisions back into operational tools.
Predictive models and agentic workflows should come after the organization has reliable data and controlled integration paths, not before.
That sequencing also makes the architecture more durable. The BI product can change without requiring the organization to rediscover every business rule.
FAQ
What is e-commerce business intelligence?
E-commerce business intelligence turns customer, order, product, marketing, inventory, and operational data into governed metrics and decision support. It normally combines data from several commerce systems rather than relying on one dashboard product.
What is the difference between e-commerce BI and business analytics?
BI usually focuses on governed reporting, monitoring, and decision support using current and historical data. Business analytics can also include more exploratory, predictive, or prescriptive techniques. In practice, enterprise platforms increasingly support both.
Does e-commerce BI replace Google Analytics?
No. GA4 is an important source of behavioral and acquisition data, but it does not replace order, refund, inventory, CRM, margin, fulfillment, or customer-service data. GA4 can export raw events to BigQuery for combination with other enterprise data.
Can BI help detect e-commerce fraud?
Yes, analytics can surface unusual transaction, account, order, return, or behavioral patterns. Fraud decisions should still be designed as a dedicated risk process because different fraud types require different data, controls, and intervention policies.
Can e-commerce BI improve cash flow?
It can improve visibility into orders, refunds, inventory, payment timing, demand, and working-capital drivers. The platform does not improve cash flow automatically, but it can provide the data required for better operational decisions.
Can BI analyze shipping costs?
Yes. Order, warehouse, carrier, service-level, destination, weight, returns, and surcharge data can be combined to compare fulfillment and shipping economics across products, regions, and carriers.
How much does an enterprise e-commerce BI implementation cost?
There is no credible universal benchmark. Cost depends on source-system complexity, data quality, warehouse usage, historical migration, BI licensing, real-time requirements, governance, security, and the number of use cases. We recommend estimating the data foundation, BI layer, integrations, governance, and ongoing cloud consumption separately.
What happens without a unified e-commerce data platform?
Teams typically create competing definitions across commerce, marketing, finance, and operations. That can lead to inconsistent revenue figures, weak attribution, fragmented customer views, duplicated data pipelines, and AI systems working from conflicting business context.
Explore Webellian’s Business Intelligence and Data Analytics services!